OpenTelemetry 追踪
追踪提供了 Prisma Client 执行活动(在操作级别)的详细日志,包括执行每个查询所需的时间。它帮助你分析应用程序的性能并识别瓶颈。追踪完全符合 OpenTelemetry,因此你可以将其作为端到端应用程序追踪系统的一部分。
追踪为你提供了 Prisma ORM 项目高度详细、操作级别的洞察。如果你需要聚合的数字报告,例如查询计数、连接计数和总查询执行时间,请参阅指标。
关于追踪
启用追踪后,Prisma Client 输出以下内容:
- Prisma Client 执行的每个操作(例如 findMany)对应一个追踪。
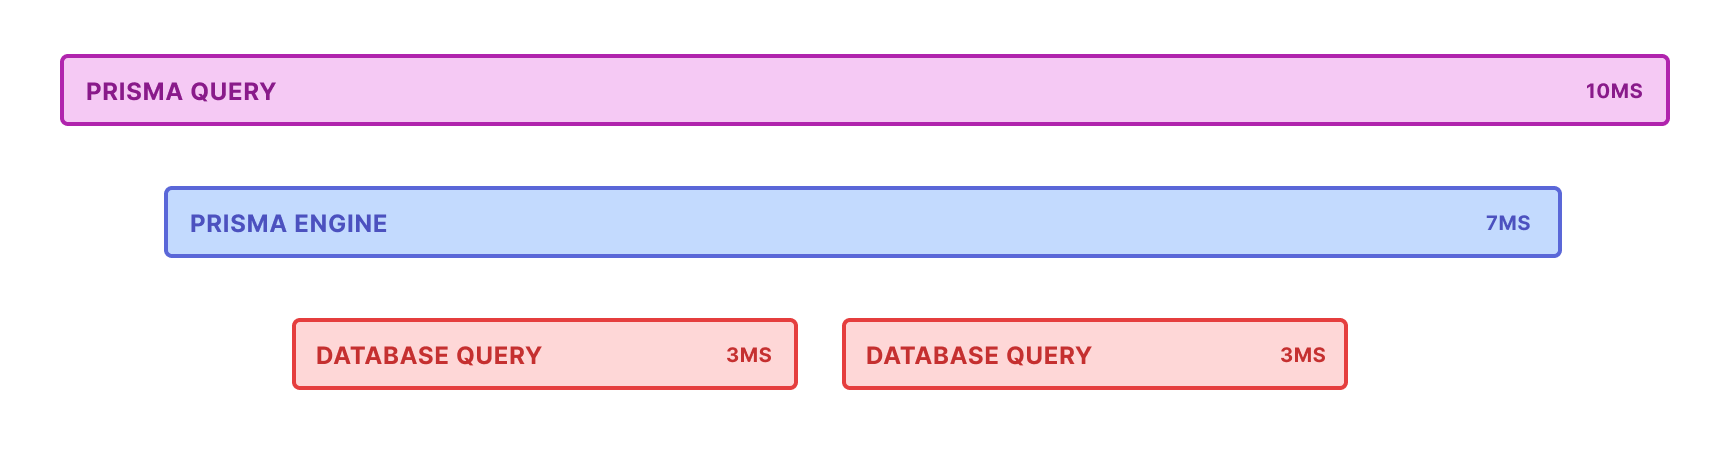
- 在每个追踪中,包含一个或多个span。每个 span 代表操作一个阶段所需的时间长度,例如序列化或数据库查询。Span 以树状结构表示,其中子 span 表示执行正在更大的父 span 内进行。
追踪中 span 的数量和类型取决于追踪所涵盖的操作类型,但例如:
你可以将追踪输出发送到控制台,或者在任何兼容 OpenTelemetry 的追踪系统中分析它,例如 Jaeger、Honeycomb 和 Datadog。在本页面上,我们提供了一个如何将追踪输出发送到 Jaeger 的示例,你可以在本地运行它。
追踪输出
对于每个追踪,Prisma Client 输出一系列 span。这些 span 的数量和类型取决于 Prisma Client 操作。典型的 Prisma 追踪包含以下 span:
prisma:client:operation:表示整个 Prisma Client 操作,从 Prisma Client 到数据库再返回。它包含诸如 Prisma Client 调用模型和方法之类的详细信息。根据 Prisma 操作的不同,它包含以下一个或多个 span:prisma:client:connect:表示 Prisma Client 连接到数据库所需的时间。prisma:client:serialize:表示验证 Prisma Client 操作并将其转换为查询引擎的查询所需的时间。prisma:engine:query:表示查询引擎中查询所需的时间。prisma:engine:connection:表示 Prisma Client 获取数据库连接所需的时间。prisma:engine:db_query:表示针对数据库执行的数据库查询。它在标签中包含查询,以及查询运行所需的时间。prisma:engine:serialize:表示将数据库的原始响应转换为类型化结果所需的时间。prisma:engine:response_json_serialization:表示将数据库查询结果序列化为 Prisma Client 的 JSON 响应所需的时间。
例如,给定以下 Prisma Client 代码:
prisma.user.findMany({
  where: {
    email: email,
  },
  include: {
    posts: true,
  },
})
追踪结构如下:
prisma:client:operationprisma:client:serializeprisma:engine:queryprisma:engine:connectionprisma:engine:db_query:第一个 SQL 查询或命令的详细信息...prisma:engine:db_query:...下一个 SQL 查询或命令的详细信息...prisma:engine:serializeprisma:engine:response_json_serialization
注意事项和先决条件
如果你的应用程序向收集器发送大量 span,这可能会对性能产生显著影响。有关如何最小化此影响的信息,请参阅减少性能影响。
要使用追踪,你必须执行以下操作:
Prisma ORM 追踪入门
本节解释如何在应用程序中安装和注册追踪。
步骤 1. 安装最新的 Prisma ORM 依赖项
使用 prisma、@prisma/client 和 @prisma/instrumentation npm 包的 6.1.0 或更高版本。你还需要安装 @opentelemetry/api 包,因为它是对等依赖项。
npm install prisma@latest --save-dev
npm install @prisma/client@latest --save
npm install @prisma/instrumentation@latest --save
npm install @opentelemetry/api@latest --save
Prisma ORM 早期版本的追踪
追踪在 Prisma ORM 4.2.0 版本中作为预览功能添加。对于 4.2.0 到 6.1.0 之间的 Prisma ORM 版本,你需要在 Prisma schema 文件中启用 tracing 预览功能。
generator client {
  provider        = "prisma-client-js"
  previewFeatures = ["tracing"]
}
步骤 2:安装 OpenTelemetry 包
现在安装相应的 OpenTelemetry 包,如下所示:
npm install @opentelemetry/semantic-conventions @opentelemetry/exporter-trace-otlp-http @opentelemetry/sdk-trace-base @opentelemetry/sdk-trace-node @opentelemetry/resources
步骤 3:在应用程序中注册追踪
以下代码提供了在 Prisma 中配置 OpenTelemetry 追踪的两个示例:
- 使用
@opentelemetry/sdk-trace-node(现有示例),它提供了对追踪设置的细粒度控制。 - 使用
@opentelemetry/sdk-node,它提供了更简单的配置,并与 OpenTelemetry 的 JavaScript 入门指南一致。
选项 1:使用 @opentelemetry/sdk-trace-node
此设置使你能够对 Instrumentation 和追踪进行细粒度控制。你需要为特定的应用程序定制此配置。这种方法简洁,对于需要快速设置以将追踪发送到 OTLP 兼容后端(如 Honeycomb、Jaeger 或 Datadog)的用户来说更容易。
// Imports
import { ATTR_SERVICE_NAME, ATTR_SERVICE_VERSION } from '@opentelemetry/semantic-conventions'
import { OTLPTraceExporter } from '@opentelemetry/exporter-trace-otlp-http'
import { SimpleSpanProcessor } from '@opentelemetry/sdk-trace-base'
import { NodeTracerProvider } from '@opentelemetry/sdk-trace-node'
import { PrismaInstrumentation, registerInstrumentations } from '@prisma/instrumentation'
import { Resource } from '@opentelemetry/resources'

// Configure the trace provider
const provider = new NodeTracerProvider({
  resource: new Resource({
    [SEMRESATTRS_SERVICE_NAME]: 'example application', // Replace with your service name
    [SEMRESATTRS_SERVICE_VERSION]: '0.0.1', // Replace with your service version
  }),
})

// Configure how spans are processed and exported. In this case, we're sending spans
// as we receive them to an OTLP-compatible collector (e.g., Jaeger).
provider.addSpanProcessor(new SimpleSpanProcessor(new OTLPTraceExporter()))

// Register your auto-instrumentors
registerInstrumentations({
  tracerProvider: provider,
  instrumentations: [new PrismaInstrumentation()],
})

// Register the provider globally
provider.register()
这种方法提供了最大的灵活性,但可能涉及额外的配置步骤。
选项 2:使用 @opentelemetry/sdk-node
对于许多用户,特别是初学者,NodeSDK 类通过将常见的默认值捆绑到单个统一配置中来简化 OpenTelemetry 设置。
// Imports
import { OTLPTraceExporter } from '@opentelemetry/exporter-trace-otlp-proto'
import { NodeSDK } from '@opentelemetry/sdk-node'
import { PrismaInstrumentation } from '@prisma/instrumentation'

// Configure the OTLP trace exporter
const traceExporter = new OTLPTraceExporter({
  url: 'https://api.honeycomb.io/v1/traces', // Replace with your collector's endpoint
  headers: {
    'x-honeycomb-team': 'HONEYCOMB_API_KEY', // Replace with your Honeycomb API key or collector auth header
  },
})

// Initialize the NodeSDK
const sdk = new NodeSDK({
  serviceName: 'my-service-name', // Replace with your service name
  traceExporter,
  instrumentations: [
    new PrismaInstrumentation({
      middleware: true, // Enable middleware tracing if needed
    }),
  ],
})

// Start the SDK
sdk.start()

// Handle graceful shutdown
process.on('SIGTERM', async () => {
  try {
    await sdk.shutdown()
    console.log('Tracing shut down successfully')
  } catch (err) {
    console.error('Error shutting down tracing', err)
  } finally {
    process.exit(0)
  }
})
如果出现以下情况,请选择 NodeSDK 方法:
- 你刚开始使用 OpenTelemetry,并希望简化设置。
- 你需要以最少的样板代码快速集成追踪。
- 你正在使用像 Honeycomb、Jaeger 或 Datadog 这样的 OTLP 兼容追踪后端。
如果出现以下情况,请选择 NodeTracerProvider 方法:
- 你需要详细控制 span 的创建、处理和导出方式。
- 你正在使用自定义 span 处理器或导出器。
- 你的应用程序需要特定的 Instrumentation 或采样策略。
OpenTelemetry 具有高度可配置性。你可以自定义资源属性、要被 Instrumentation 的组件、span 的处理方式以及 span 的发送位置。
你可以在此示例应用程序中找到一个包含指标的完整示例。
追踪操作指南
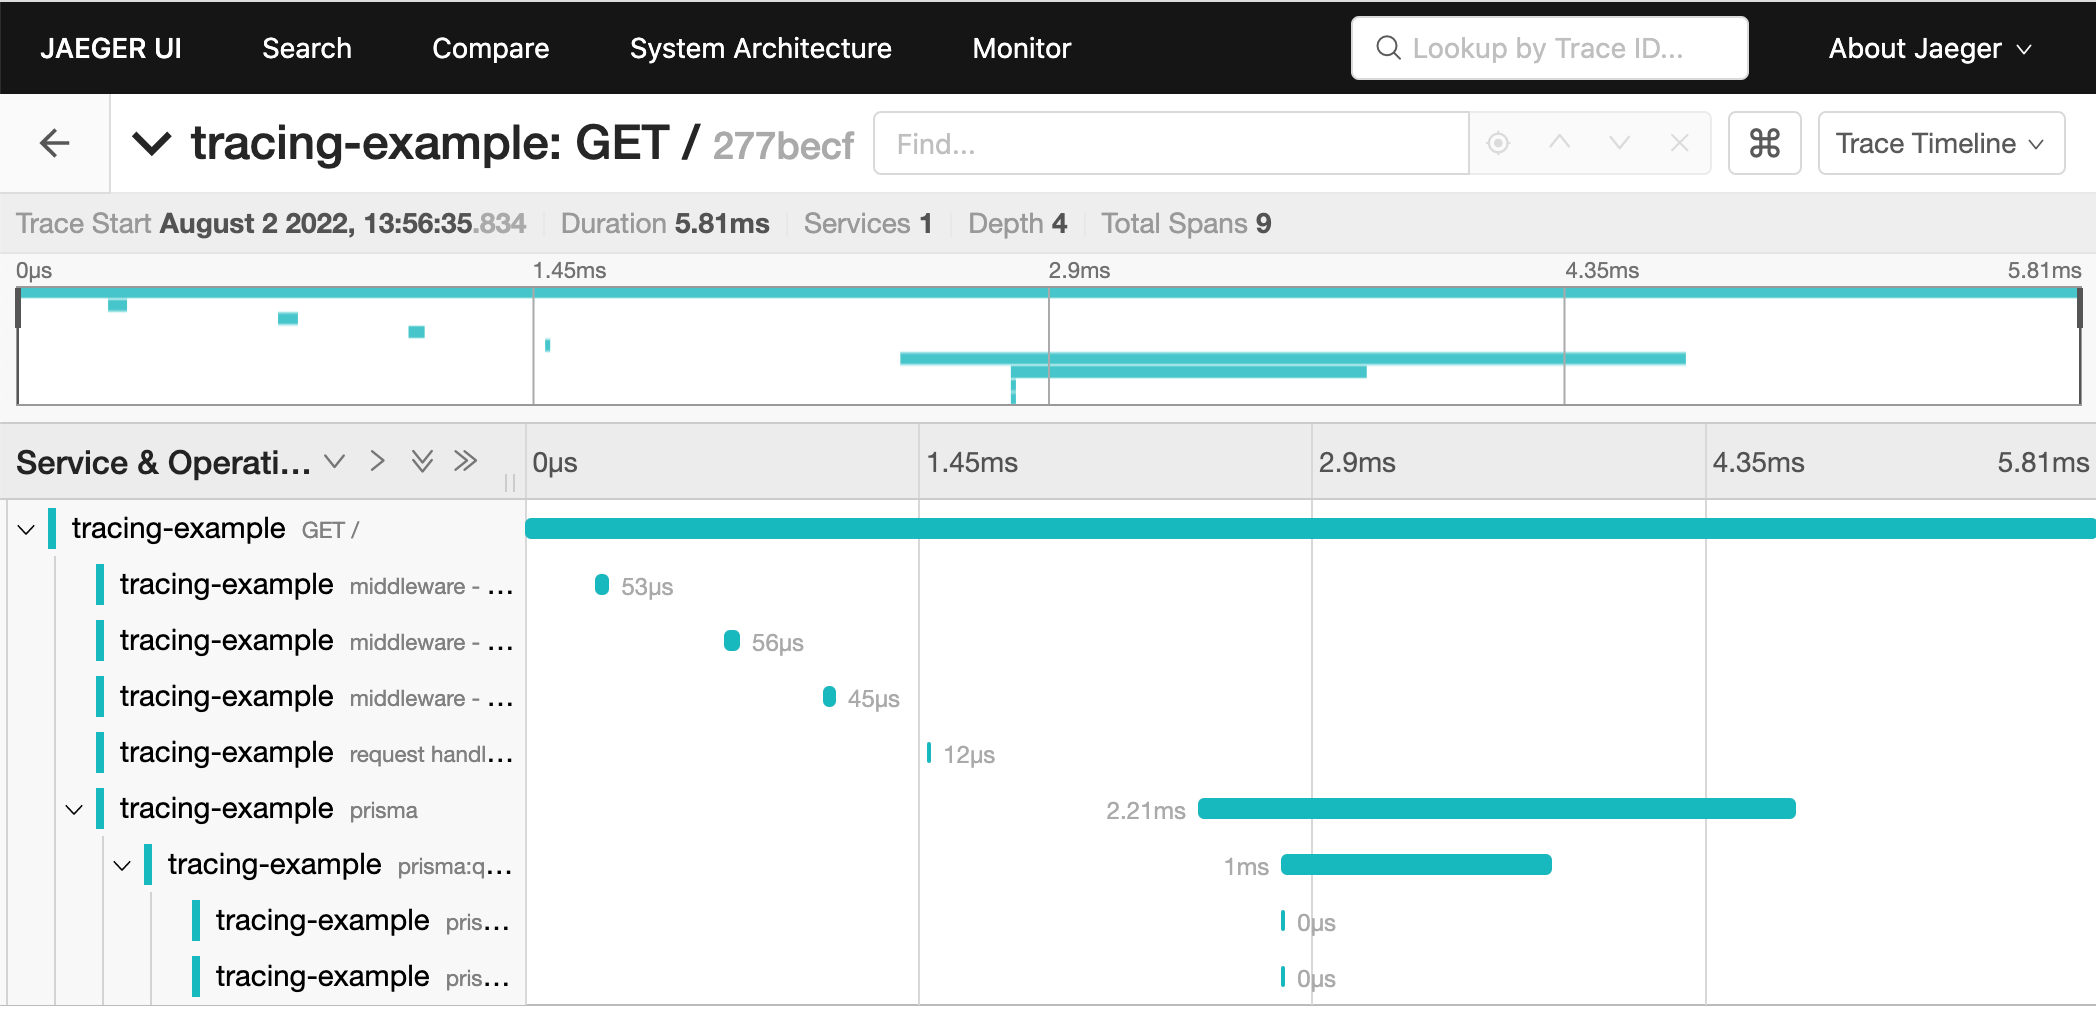
使用 Jaeger 可视化追踪
Jaeger 是一个免费的开源 OpenTelemetry 收集器和仪表板,你可以使用它来可视化你的追踪。
以下屏幕截图显示了一个示例追踪可视化:
要在本地运行 Jaeger,请使用以下 Docker 命令:
docker run --rm --name jaeger -d -e COLLECTOR_OTLP_ENABLED=true -p 16686:16686 -p 4318:4318 jaegertracing/all-in-one:latest
现在你可以在 https://:16686/ 找到追踪仪表板。当你使用启用了追踪的应用程序时,你将开始在此仪表板中看到追踪。
将追踪输出发送到控制台
以下示例使用 @opentelemetry/sdk-trace-base 中的 ConsoleSpanExporter 将输出追踪发送到控制台。
// Imports
import { SemanticResourceAttributes } from '@opentelemetry/semantic-conventions'
import {
  BasicTracerProvider,
  ConsoleSpanExporter,
  SimpleSpanProcessor,
} from '@opentelemetry/sdk-trace-base'
import { AsyncHooksContextManager } from '@opentelemetry/context-async-hooks'
import * as api from '@opentelemetry/api'
import { PrismaInstrumentation, registerInstrumentations } from '@prisma/instrumentation'
import { Resource } from '@opentelemetry/resources'

// Export the tracing
export function otelSetup() {
  const contextManager = new AsyncHooksContextManager().enable()

  api.context.setGlobalContextManager(contextManager)

  //Configure the console exporter
  const consoleExporter = new ConsoleSpanExporter()

  // Configure the trace provider
  const provider = new BasicTracerProvider({
    resource: new Resource({
      [SemanticResourceAttributes.SERVICE_NAME]: 'test-tracing-service',
      [SemanticResourceAttributes.SERVICE_VERSION]: '1.0.0',
    }),
  })

  // Configure how spans are processed and exported. In this case we're sending spans
  // as we receive them to the console
  provider.addSpanProcessor(new SimpleSpanProcessor(consoleExporter))

  // Register your auto-instrumentors
  registerInstrumentations({
    tracerProvider: provider,
    instrumentations: [new PrismaInstrumentation()],
  })

  // Register the provider
  provider.register()
}
追踪 Prisma Client 中间件
默认情况下,追踪不会为Prisma Client 中间件输出 span。要将中间件包含在追踪中,请在 registerInstrumentations 语句中将 middleware 设置为 true,如下所示:
registerInstrumentations({
  instrumentations: [new PrismaInstrumentation({ middleware: true })],
})
这将向你的追踪添加以下 span 类型:
prisma:client:middleware:表示操作在你的中间件中花费的时间。
追踪交互式事务
当你执行交互式事务时,除了标准 span 之外,你还会看到以下 span:
prisma:client:transaction:一个包裹prismaspan 的根 span。prisma:engine:itx_runner:表示交互式事务在查询引擎中花费的时间。prisma:engine:itx_query_builder:表示构建交互式事务所需的时间。
例如,以下 Prisma schema:
generator client {
  provider        = "prisma-client-js"
}

datasource db {
  provider = "postgresql"
  url      = env("DATABASE_URL")
}

model User {
  id    Int    @id @default(autoincrement())
  email String @unique
}

model Audit {
  id     Int    @id
  table  String
  action String
}
给定以下交互式事务:
await prisma.$transaction(async (tx) => {
  const user = await tx.user.create({
    data: {
      email: email,
    },
  })

  await tx.audit.create({
    data: {
      table: 'user',
      action: 'create',
      id: user.id,
    },
  })

  return user
})
追踪结构如下:
prisma:client:transactionprisma:client:connectprisma:engine:itx_runnerprisma:engine:connectionprisma:engine:db_queryprisma:engine:itx_query_builderprisma:engine:db_queryprisma:engine:db_queryprisma:engine:serialize
prisma:engine:itx_query_builderprisma:engine:db_queryprisma:engine:db_queryprisma:engine:serialize
prisma:client:operationprisma:client:serialize
prisma:client:operationprisma:client:serialize
添加更多 Instrumentation
OpenTelemetry 的一个好处是能够通过对应用程序代码进行最少更改来添加更多 Instrumentation。
例如,要添加 HTTP 和 ExpressJS 追踪,请将以下 instrumentations 添加到你的 OpenTelemetry 配置中。这些 instrumentations 为完整的请求-响应生命周期添加了 span。这些 span 显示了你的 HTTP 请求花费了多长时间。
// Imports
import { ExpressInstrumentation } from '@opentelemetry/instrumentation-express'
import { HttpInstrumentation } from '@opentelemetry/instrumentation-http'

// Register your auto-instrumentors
registerInstrumentations({
  tracerProvider: provider,
  instrumentations: [
    new HttpInstrumentation(),
    new ExpressInstrumentation(),
    new PrismaInstrumentation(),
  ],
})
有关可用 instrumentations 的完整列表,请查看 OpenTelemetry Registry。
自定义资源属性
你可以通过更改资源属性使其更具体地适用于你的应用程序,从而调整应用程序追踪的分组方式:
const provider = new NodeTracerProvider({
  resource: new Resource({
    [SemanticResourceAttributes.SERVICE_NAME]: 'weblog',
    [SemanticResourceAttributes.SERVICE_VERSION]: '1.0.0',
  }),
})
目前正在努力标准化常用资源属性。在可能的情况下,最好遵循标准属性名称。
减少性能影响
如果你的应用程序向收集器发送大量 span,这可能会对性能产生显著影响。你可以使用以下方法来减少此影响:
使用 BatchSpanProcessor 批量发送追踪
在生产环境中,你可以使用 OpenTelemetry 的 BatchSpanProcessor 以批量而不是一次一个的方式将 span 发送到收集器。然而,在开发和测试期间,你可能不想批量发送 span。在这种情况下,你可能更喜欢使用 SimpleSpanProcessor。
你可以配置你的追踪配置,以便根据环境使用适当的 span 处理器,如下所示:
import {
  SimpleSpanProcessor,
  BatchSpanProcessor,
} from '@opentelemetry/sdk-trace-base'

if (process.env.NODE_ENV === 'production') {
  provider.addSpanProcessor(new BatchSpanProcessor(otlpTraceExporter))
} else {
  provider.addSpanProcessor(new SimpleSpanProcessor(otlpTraceExporter))
}
使用采样向收集器发送更少的 span
另一种减少性能影响的方法是使用概率采样来向收集器发送更少的 span。这降低了追踪的收集成本,但仍然能很好地表示应用程序中发生的情况。
一个示例实现如下所示:
import { SemanticResourceAttributes } from '@opentelemetry/semantic-conventions'
import { NodeTracerProvider } from '@opentelemetry/sdk-trace-node'
import { TraceIdRatioBasedSampler } from '@opentelemetry/core'
import { Resource } from '@opentelemetry/resources'

const provider = new NodeTracerProvider({
  sampler: new TraceIdRatioBasedSampler(0.1),
  resource: new Resource({
    // we can define some metadata about the trace resource
    [SemanticResourceAttributes.SERVICE_NAME]: 'test-tracing-service',
    [SemanticResourceAttributes.SERVICE_VERSION]: '1.0.0',
  }),
})
追踪故障排除
我的追踪没有显示
你设置追踪的顺序很重要。在你的应用程序中,请确保在导入任何被 Instrumentation 的依赖项之前注册追踪和 Instrumentation。例如:
import { registerTracing } from './tracing'

registerTracing({
  name: 'tracing-example',
  version: '0.0.1',
})

// You must import any dependencies after you register tracing.
import { PrismaClient } from '@prisma/client'
import async from 'express-async-handler'
import express from 'express'